
Discover the Power of Analytics
Unlock insights and drive growth with Analytics Space, the leading analytics firm in India.
Data Analysis
Insights to drive informed business decisions.
Visualize data for better understanding and impact.
Predict future trends with our modeling.
Data Visualization
Predictive Modeling
About US
Analytics Space is a forward-thinking consulting firm specializing in analytics and artificial intelligence that empowers businesses to make truly data-driven decisions. Our team of experts is dedicated to developing custom AI-driven solutions tailored to meet the unique challenges and opportunities of your business. By integrating cutting-edge technologies with deep industry insights, we ensure that our clients can harness the full potential of their data, enabling more precise strategies, improved operational efficiency, and a sustainable competitive advantage.
We offer a comprehensive suite of services that include AI-powered data analysis, dynamic visualization, and advanced predictive modeling techniques. By emphasizing the importance of accurate, high-quality data, we transform raw information into actionable intelligence that uncovers hidden trends and forecasts future outcomes. Let’s collaborate to unlock the power of your data, drive innovation, and propel your business forward with state-of-the-art AI technologies.


Data-Driven Solutions
We help businesses leverage data for informed decision-making and strategic growth.


Custom Data Analysis
Tailored analysis to meet your unique business needs effectively.
Predictive Modeling
Forecast trends and enhance decision-making with accurate predictive models.
Data Visualization
Transform data into clear visuals that drive insights and action.
Data Solutions
Empowering businesses through tailored analytics and data-driven strategies.


Custom Analytics
Our team crafts personalized analytics solutions to meet your specific business needs and challenges, ensuring you harness the full potential of your data for informed decision-making.
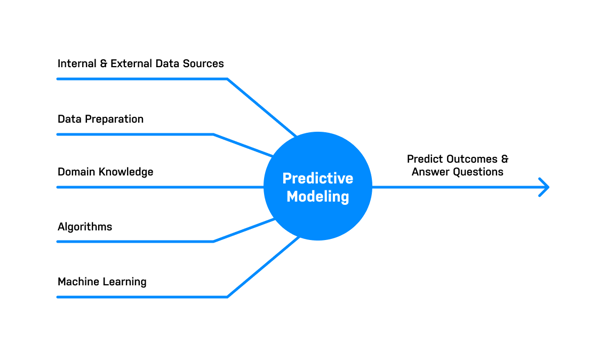
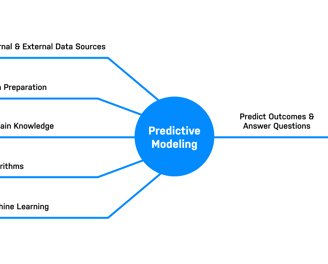
Predictive Modeling
Utilizing advanced predictive modeling techniques, we help businesses forecast trends and make proactive decisions, transforming data insights into actionable strategies for growth and success.
Our Clients

© 2021. All rights reserved.